Portfolio Overview
Total Acquisition Price1,558.9billion yen
As of July 1, 2026
- Toyosu Bayside Cross Tower
- Toyosu Bayside Cross Tower(Additional Acquisition)
- NBF Osaki Bldg.
- Gate City Ohsaki
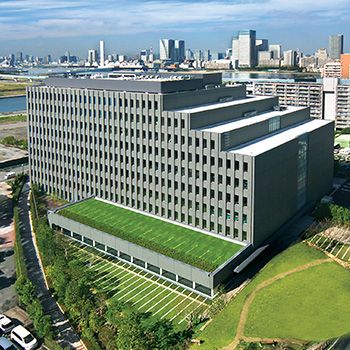
- NBF Toyosu Canal Front
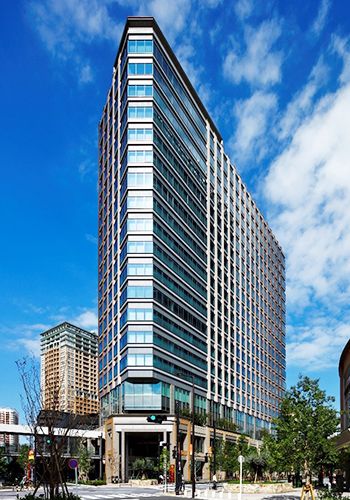
- Ueno East Tower
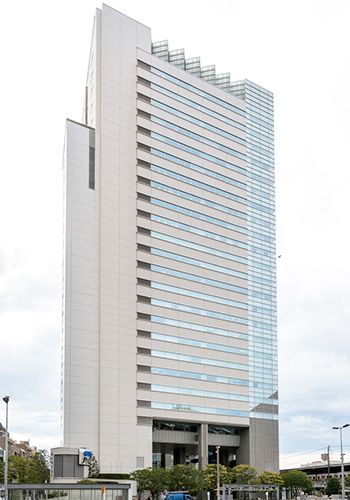
- NBF Toyosu Garden Front
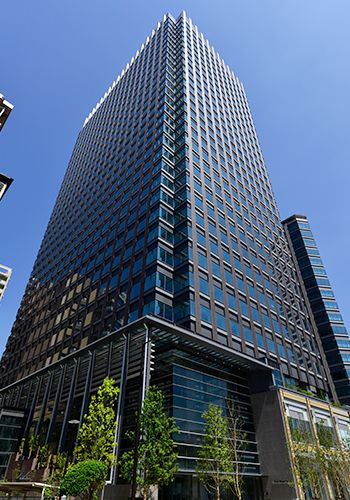
- Osaki Bright Core - Bright Plaza
- Nakameguro GT Tower
- Osaki Bright Tower
- NBF Ikebukuro East
- Higashi Gotanda Square
- NBF Ikebukuro Tower
- NBF Ikebukuro City Bldg.
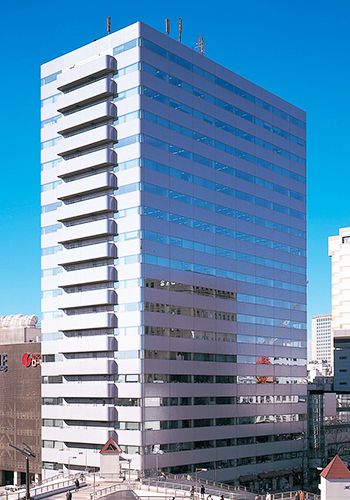
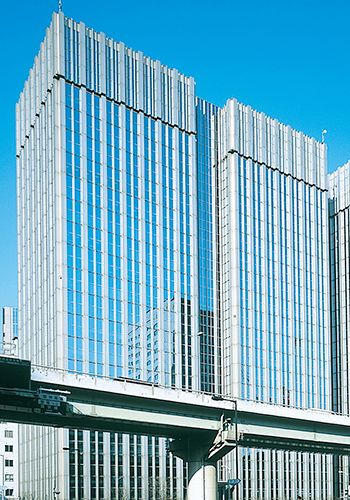
- Shinjuku Mitsui Bldg.
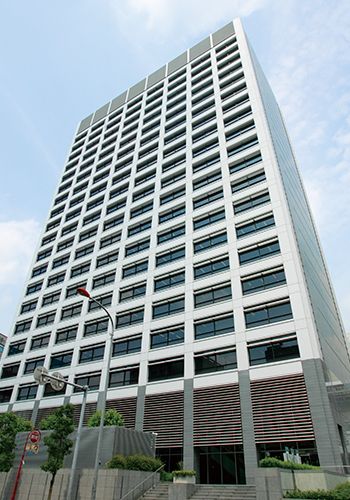
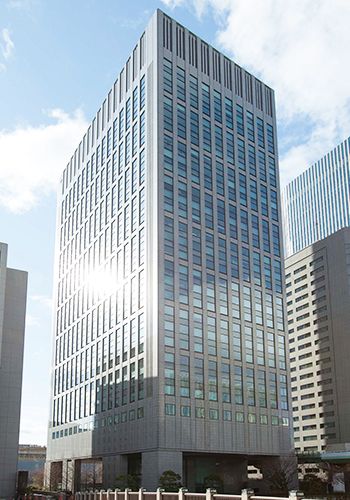
- IIDABASHI GRAND BLOOM
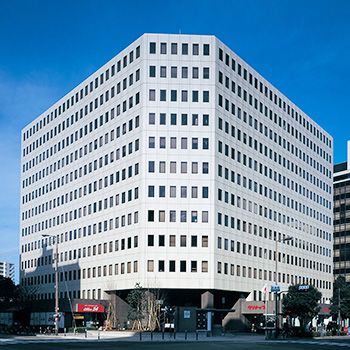
- Roppongi T-CUBE
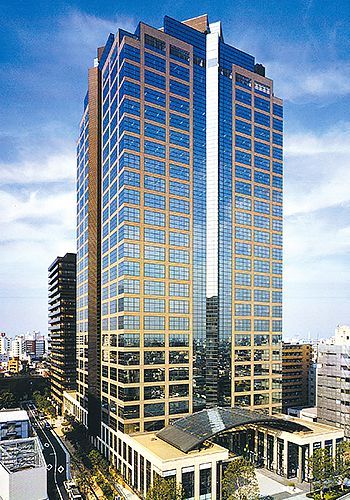
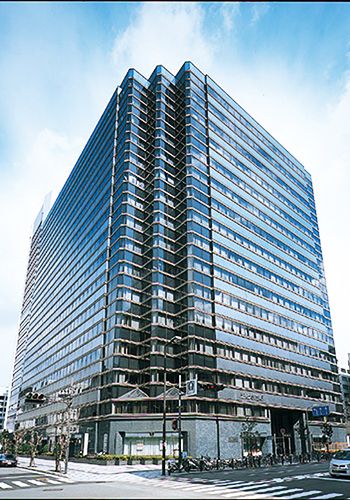
- Nishi-Shinjuku Mitsui Bldg.
- Nishi-Shinjuku Mitsui Bldg.(Additional Acquisition)
- Celestine Shiba Mitsui Bldg.
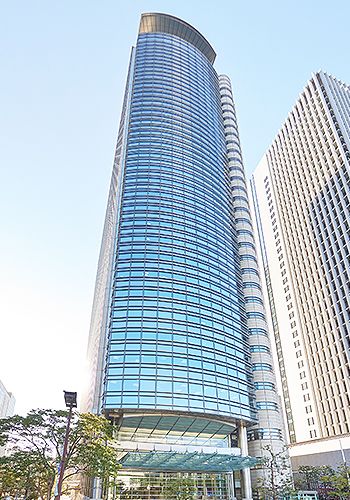
- NBF Shinagawa Tower
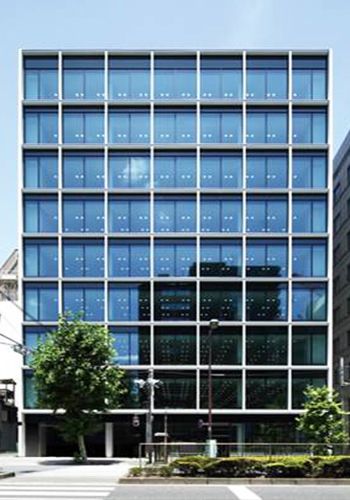
- Nihonbashi Honcho M-SQUARE
- NBF Platinum Tower
- NBF COMODIO Shiodome
- G-BASE TAMACHI
- Toranomon Kotohira Tower
- NBF Shibuya Garden Front
- NBF Ginza Street Bldg.
- Shinjuku Mitsui Bldg. No.2
- Kowa Nishi-Shinbashi Bldg. B
- River City M-SQUARE
- Shinbashi M-SQUARE
- NBF Toranomon Bldg.(Land with leasehold interest)
- GranTokyo South Tower
- NBF ALLIANCE
- Yotsuya Medical Bldg.
- NBF Shibuya East
- NBF Takanawa Bldg.
- NBF Akasaka Sanno Square
- NBF Kandasudacho Bldg.
- NBF Ogawamachi Bldg.
- NBF Higashi-Ginza Square
- Nihonbashi Kabuto-cho M-SQUARE
- NBF Hatchobori Terrace
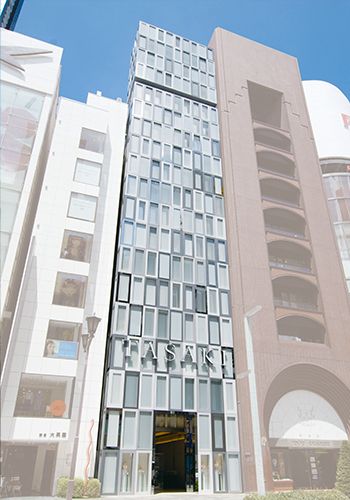
- Ryukakusan Bldg.
- Jingumae M-SQUARE
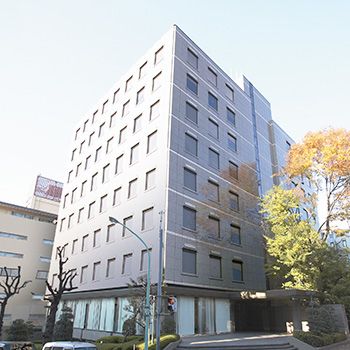
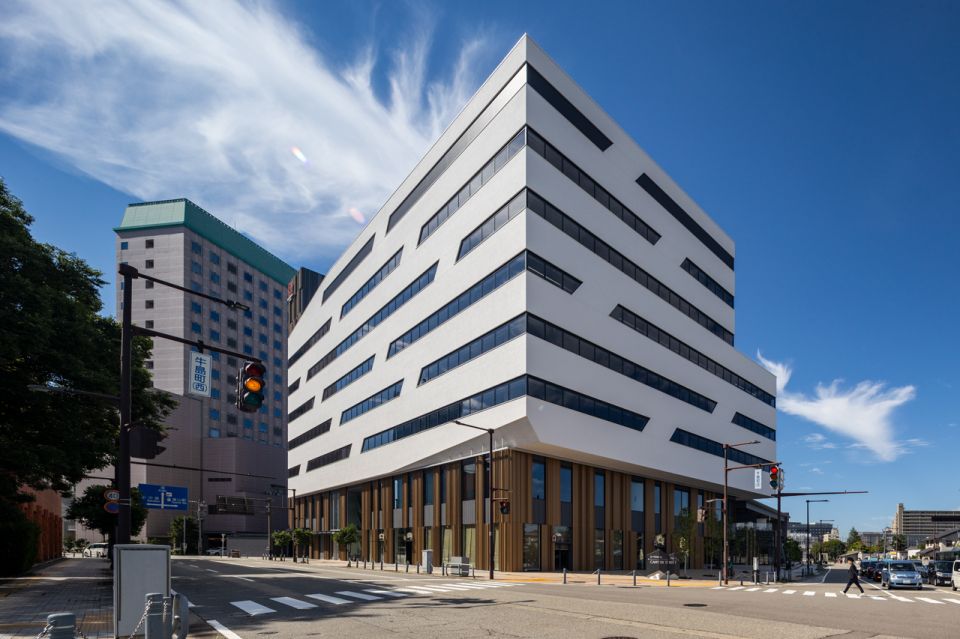
- NBF CONNECT SAPPORO
- Sapporo L-Plaza
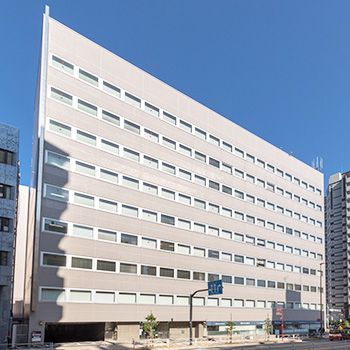
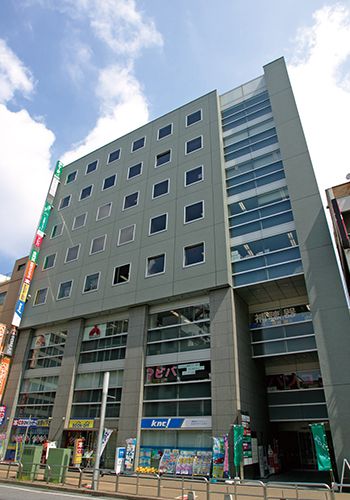
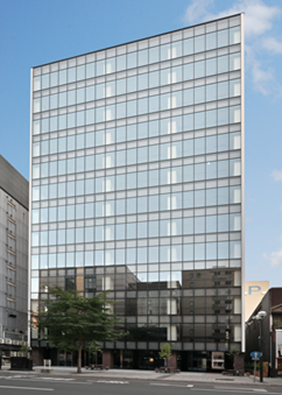
- D-TOWER TOYAMA
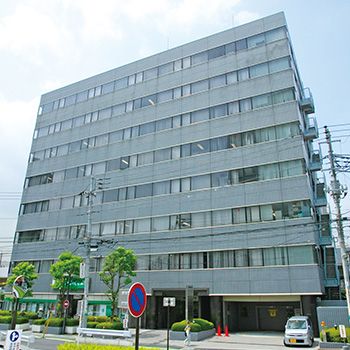
- Sumitomo Mitsui Banking Nagoya Bldg.
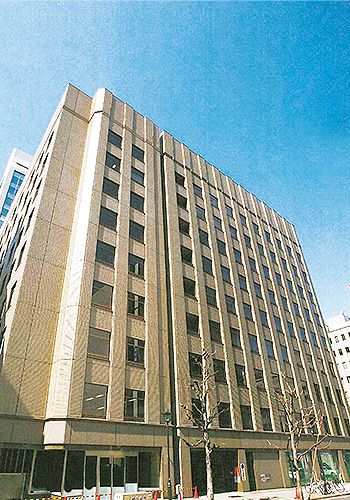
- Nagoya Mitsui New Bldg.
- Nagoya Mitsui Main Bldg.
- NBF Nagoya Hirokoji Bldg.
- Nakanoshima Mitsui Bldg.
- Aqua Dojima NBF Tower
- Nakanoshima Central Tower
- Shinanobashi Mitsui Bldg.
- Sakaisuji-Honmachi Center Bldg.
- Yodoyabashi Flex Tower
- Hiroshima Fukuromachi Bldg.
- NBF Matsuyama Nichigin-mae Bldg.
- Hakata Gion M-SQUARE
- NBF Kumamoto Bldg.
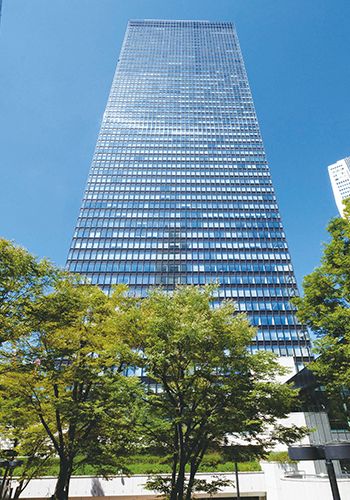
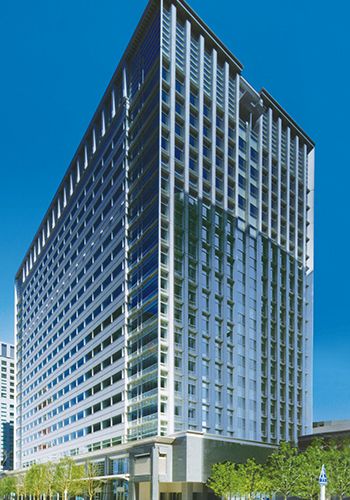
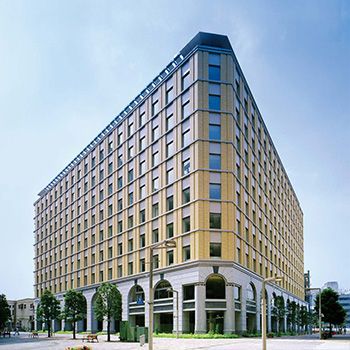
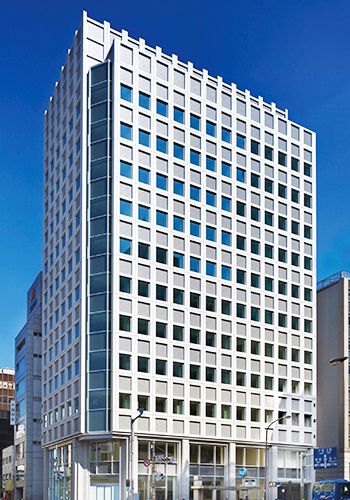
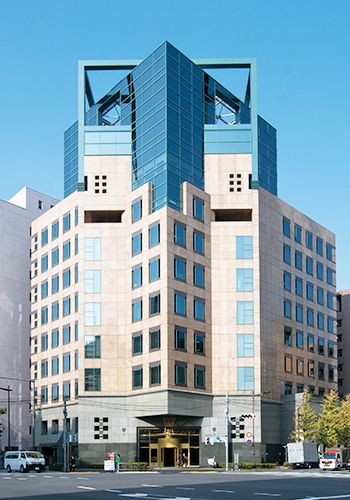
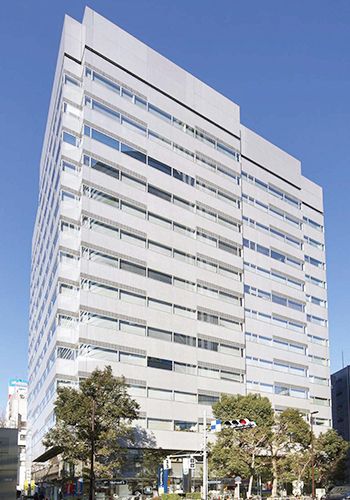
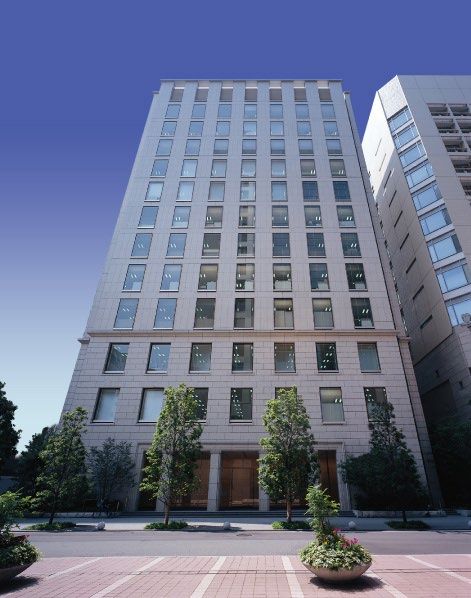
Shinjuku Mitsui Bldg.
Shinjuku-ku,Tokyo
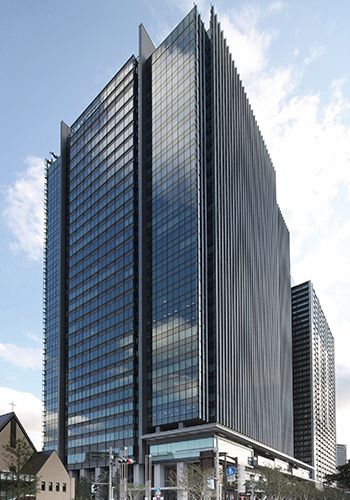
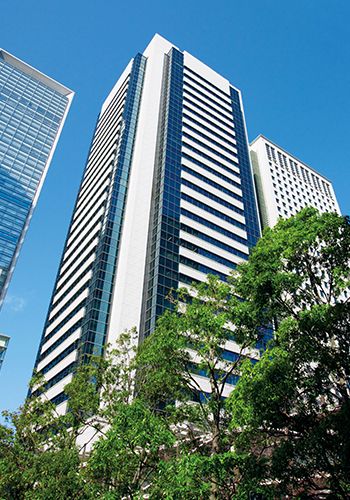
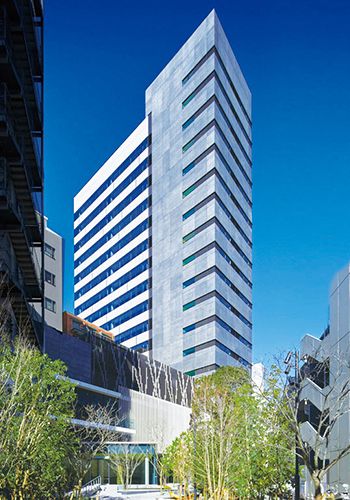
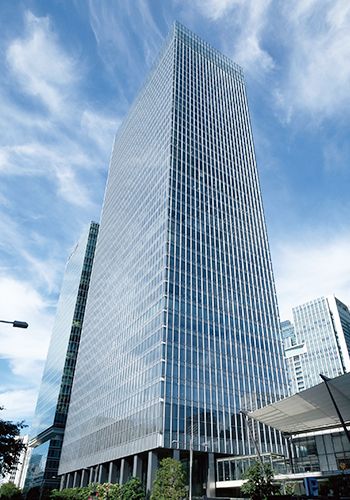
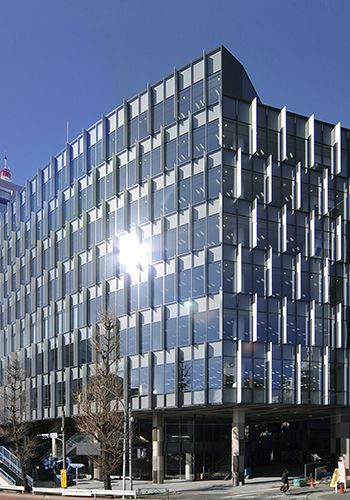
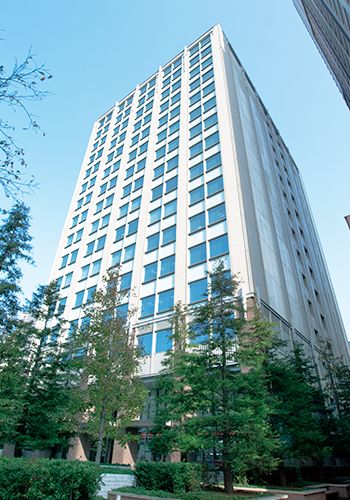
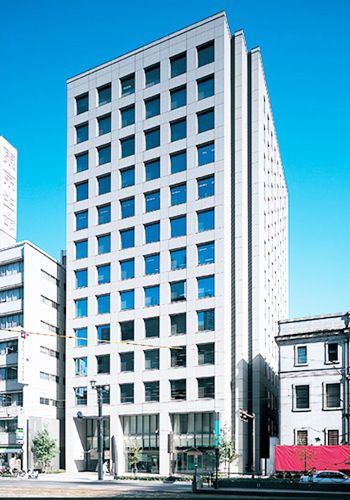
IIDABASHI GRAND BLOOM
Chiyoda-ku,Tokyo
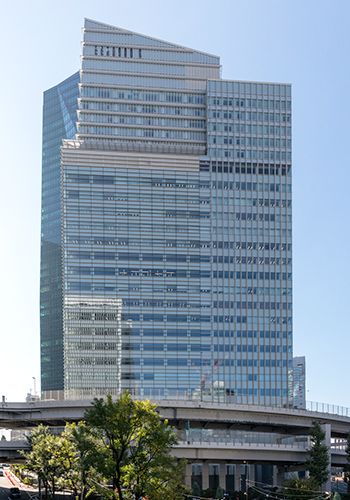
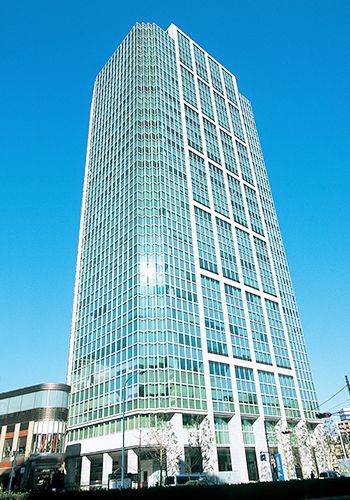
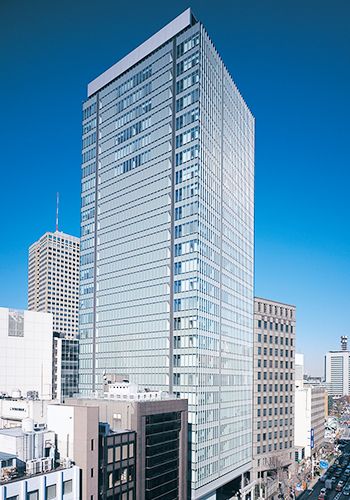
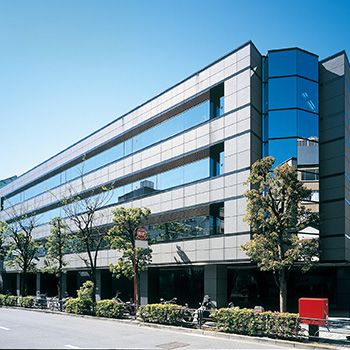
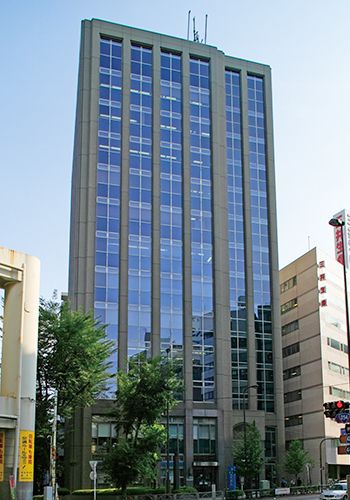
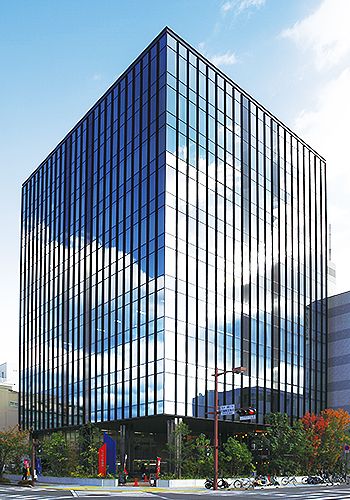
Roppongi T-CUBE
Minato-ku, Tokyo

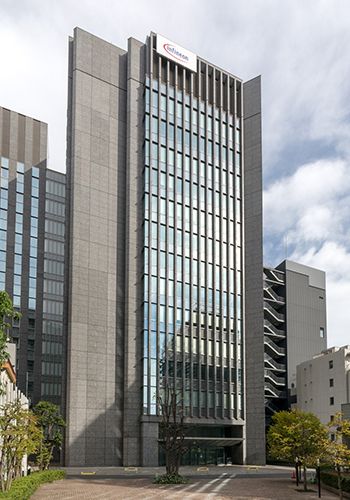
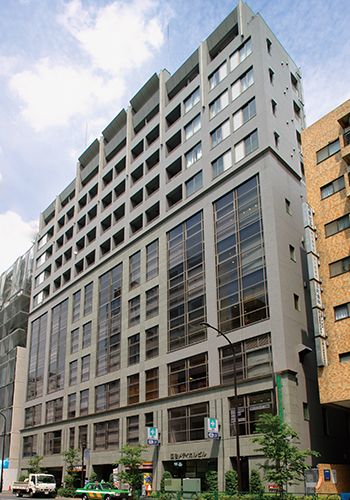
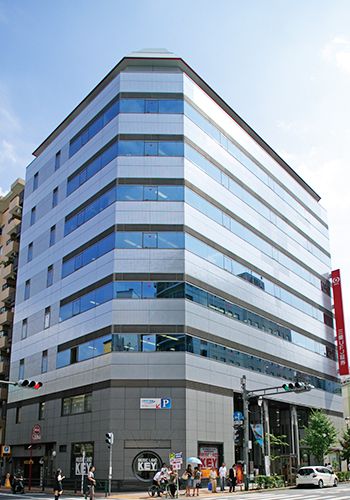
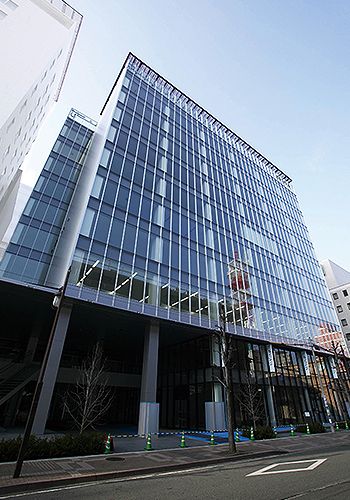
Nishi-Shinjuku Mitsui Bldg.
Shinjuku-ku, Tokyo
Nishi-Shinjuku Mitsui Bldg.(Additional Acquisition)
Shinjuku-ku, Tokyo
Celestine Shiba Mitsui Bldg.
Minato-ku, Tokyo
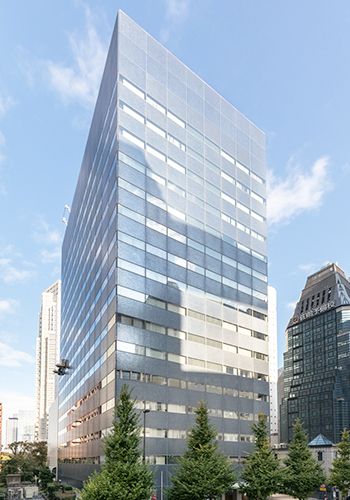
NBF Shinagawa Tower
Minato-ku, Tokyo
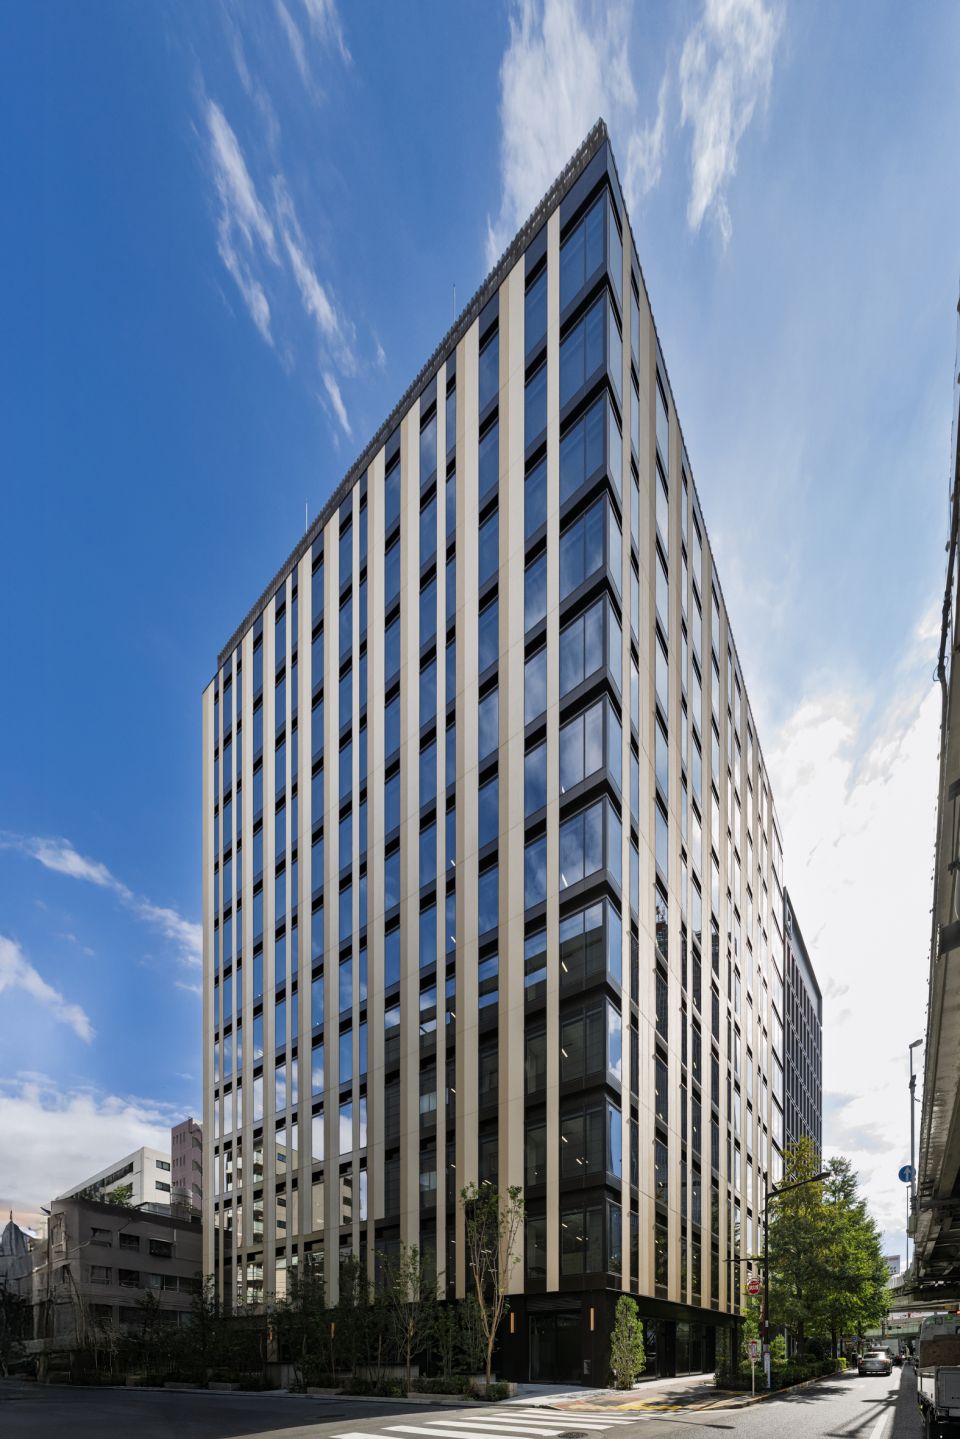
Nihonbashi Honcho M-SQUARE
Chuo-ku, Tokyo
NBF Platinum Tower
Minato-ku, Tokyo
NBF COMODIO Shiodome
Minato-ku, Tokyo
G-BASE TAMACHI
Minato-ku, Tokyo
Toranomon Kotohira Tower
Minato-ku, Tokyo
NBF Shibuya Garden Front
Shibuya-ku, Tokyo
NBF Ginza Street Bldg.
Chuo-ku, Tokyo
Shinjuku Mitsui Bldg. No.2
Shinjuku-ku, Tokyo
Kowa Nishi-Shinbashi Bldg. B
Minato-ku, Tokyo
River City M-SQUARE
Chuo-ku, Tokyo
Shinbashi M-SQUARE
Minato-ku, Tokyo
NBF Toranomon Bldg.(Land with leasehold interest)
Minato-ku, Tokyo
GranTokyo South Tower
Chiyoda-ku, Tokyo
NBF ALLIANCE
Minato-ku, Tokyo
Yotsuya Medical Bldg.
Shinjuku-ku, Tokyo
NBF Shibuya East
Shibuya-ku, Tokyo
NBF Takanawa Bldg.
Minato-ku, Tokyo
NBF Akasaka Sanno Square
Minato-ku, Tokyo
NBF Kandasudacho Bldg.
Chiyoda-ku, Tokyo
NBF Ogawamachi Bldg.
Chiyoda-ku, Tokyo
NBF Higashi-Ginza Square
Chuo-ku, Tokyo
Nihonbashi Kabuto-cho M-SQUARE
Chuo-ku, Tokyo
NBF Hatchobori Terrace
Chuo-ku, Tokyo
Ryukakusan Bldg.
Chiyoda-ku, Tokyo
Jingumae M-SQUARE
Shibuya-ku, Tokyo
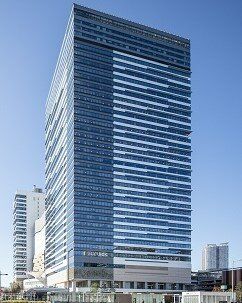
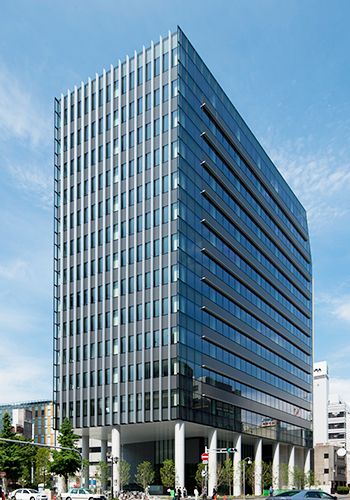
Toyosu Bayside Cross Tower
Koto-ku, Tokyo
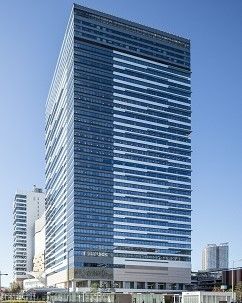
Toyosu Bayside Cross Tower(Additional Acquisition)
Koto-ku, Tokyo
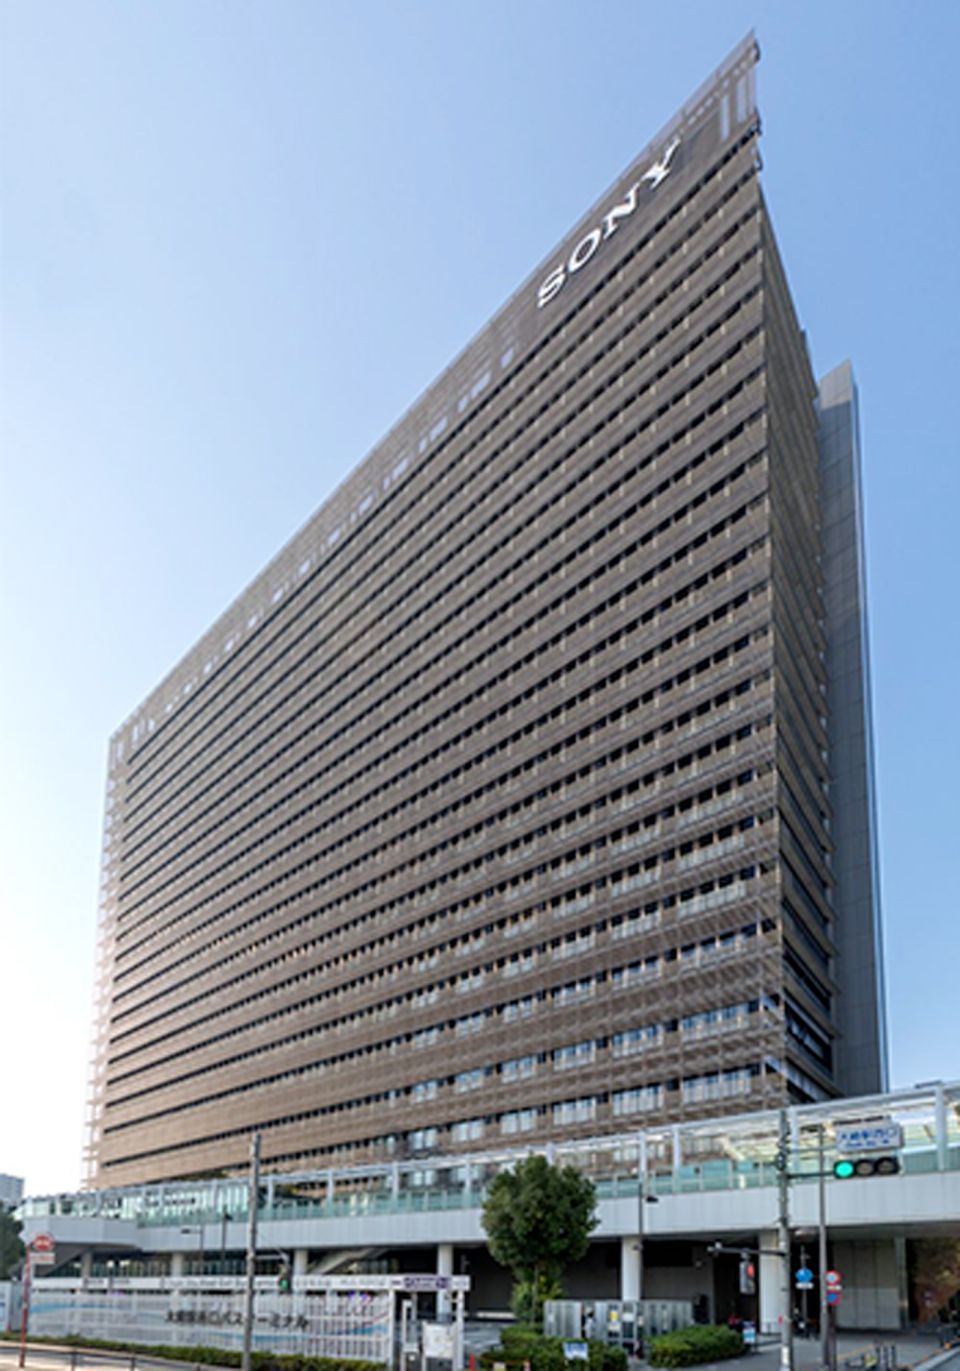
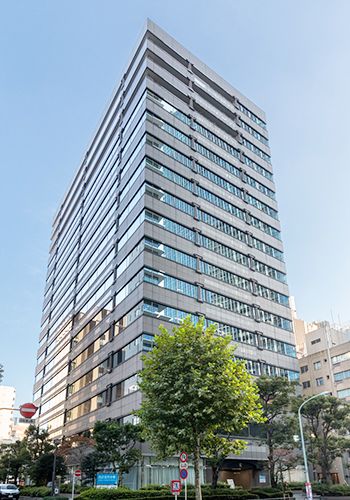
NBF Osaki Bldg.
Shinagawa-ku, Tokyo
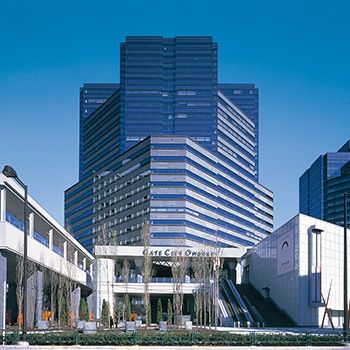
Gate City Ohsaki
Shinagawa-ku, Tokyo
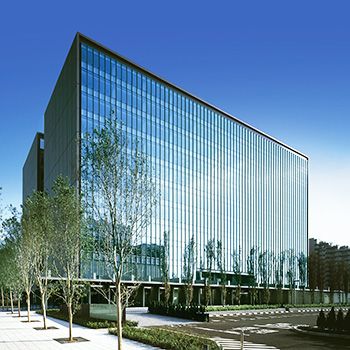
NBF Toyosu Canal Front
Koto-ku, Tokyo
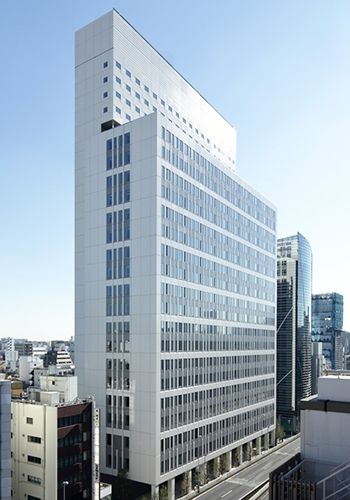
Ueno East Tower
Taito-ku, Tokyo
NBF Toyosu Garden Front
Koto-ku, Tokyo
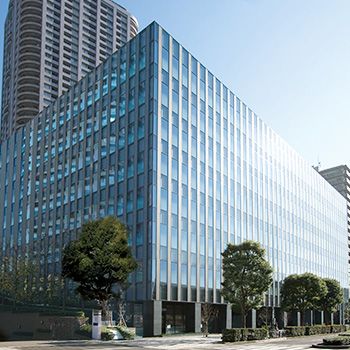
Osaki Bright Core - Bright Plaza
Shinagawa-ku, Tokyo
Nakameguro GT Tower
Meguro-ku, Tokyo
Osaki Bright Tower
Shinagawa-ku, Tokyo
NBF Ikebukuro East
Toshima-ku, Tokyo
Higashi Gotanda Square
Shinagawa-ku, Tokyo
NBF Ikebukuro Tower
Toshima-ku, Tokyo
NBF Ikebukuro City Bldg.
Toshima-ku, Tokyo
Chofu South Gate Bldg.
Chofu City, Tokyo
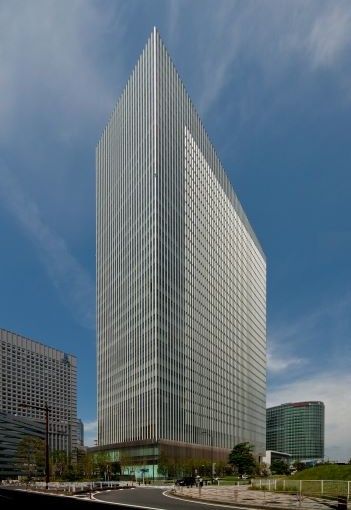
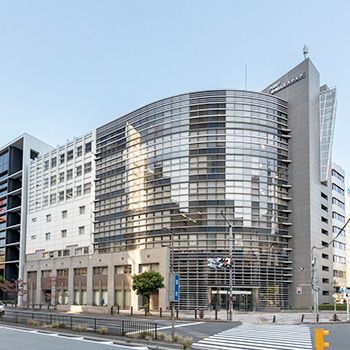
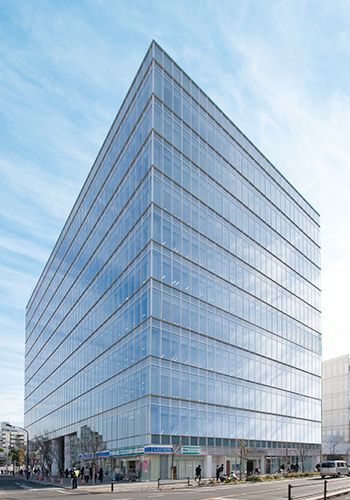
Yokohama Mitsui Bldg.
Yokohama City, Kanagawa
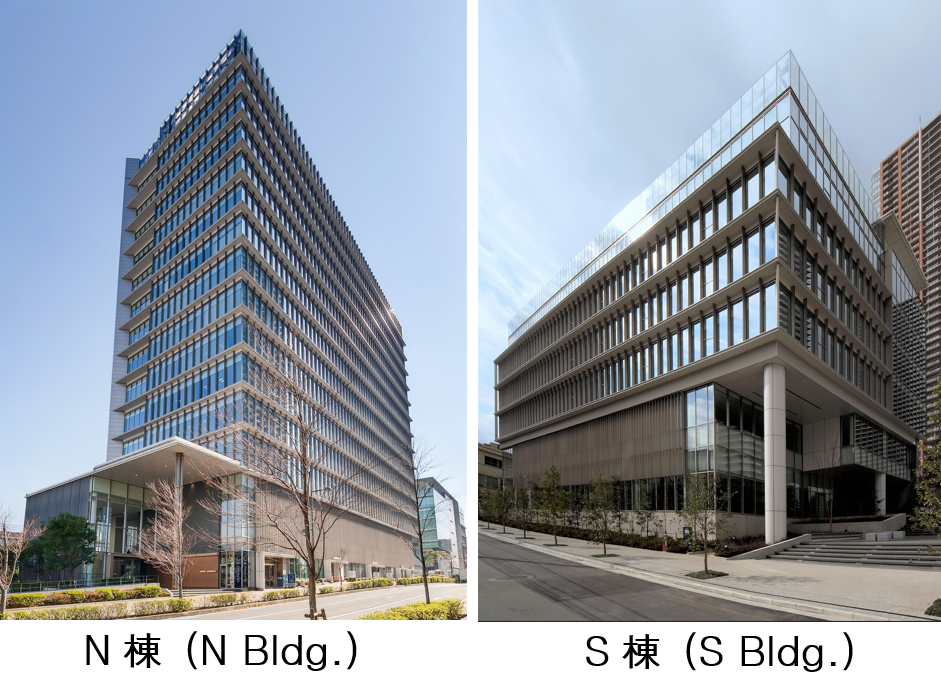
NBF Musashikosugi Bldg., N Bldg. and S Bldg.
Kawasaki City,
Kanagawa
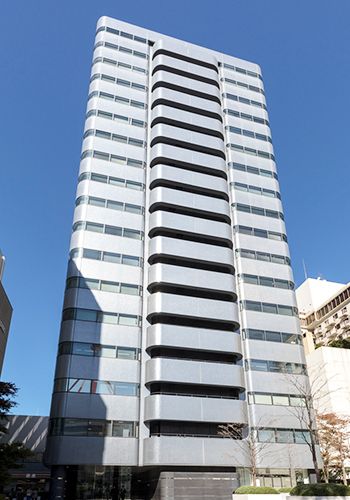
Yokohama ST Bldg.
Yokohama City, Kanagawa
Parale Mitsui Bldg.
Kawasaki City, Kanagawa
S-ino Omiya North Wing
Saitama City, Saitama
NBF Urawa Bldg.
Saitama City, Saitama
NBF Matsudo Bldg.
Matsudo City, Chiba
NBF CONNECT SAPPORO
Sapporo City, Hokkaido
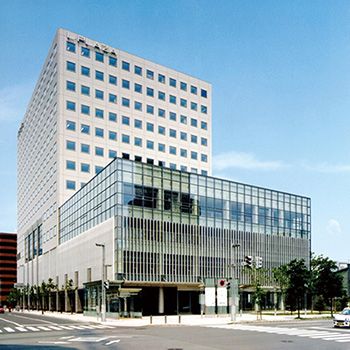
Sapporo L-Plaza
Sapporo City, Hokkaido
D-TOWER TOYAMA
Toyama City, Toyama
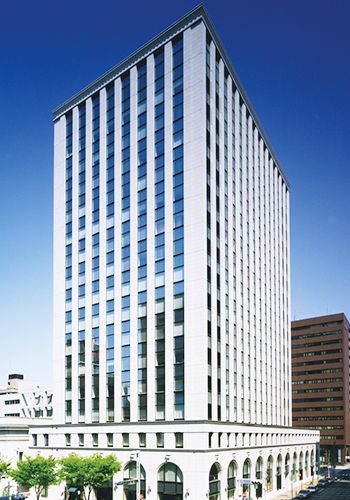
Sumitomo Mitsui Banking Nagoya Bldg.
Nagoya City, Aichi
Nagoya Mitsui New Bldg.
Nagoya City, Aichi
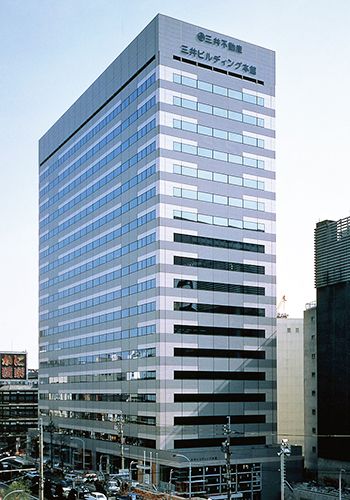
Nagoya Mitsui Main Bldg.
Nagoya City, Aichi
NBF Nagoya Hirokoji Bldg.
Nagoya City, Aichi
Nakanoshima Mitsui Bldg.
Osaka City, Osaka
Aqua Dojima NBF Tower
Osaka City, Osaka
Nakanoshima Central Tower
Osaka City, Osaka
Shinanobashi Mitsui Bldg.
Osaka City, Osaka
Sakaisuji-Honmachi Center Bldg.
Osaka City, Osaka
Yodoyabashi Flex Tower
Osaka City, Osaka
Hiroshima Fukuromachi Bldg.
Hiroshima City, Hiroshima
NBF Matsuyama Nichigin-mae Bldg.
Matsuyama City, Ehime

Hakata Gion M-SQUARE
Fukuoka City, Fukuoka
NBF Kumamoto Bldg.
Kumamoto City, Kumamoto
| Property Name Location |
Acquisition Date |
Construction Completion |
Total Rentable Area(㎡) |
Acquisition Price (Yen in million) |
Appraisal Value (Yen in million) |
||
|---|---|---|---|---|---|---|---|
|
|
|
Ratio(%) |
|
Ratio(%) | |||
| 2Shinjuku Mitsui Bldg. Shinjuku-ku,Tokyo Central 5 Wards |
2021. 1 | 1974. 9 | 102,718 | 170,000 | 10.9 | 184,000 | 10.1 |
| 2IIDABASHI GRAND BLOOM Chiyoda-ku,Tokyo Central 5 Wards |
2021. 9 2022. 3 2023. 3 |
2014. 4 | 54,185 | 138,909 | 8.9 | 154,000 | 8.5 |
| 2Roppongi T-CUBE Minato-ku, Tokyo Central 5 Wards |
2018. 3 | 2003. 9 | 34,608 | 62,800 | 4.0 | 63,200 | 3.5 |
| 2Nishi-Shinjuku Mitsui Bldg. Shinjuku-ku, Tokyo Central 5 Wards |
2002. 9 2006. 4 2011. 12 2012. 11 2013. 12 2016. 7 2019. 7 2023. 9 |
1999. 4 | 33,770 | 45,392 | 2.9 | 46,100 | 2.5 |
| 2Nishi-Shinjuku Mitsui Bldg.(Additional Acquisition) Shinjuku-ku, Tokyo Central 5 Wards |
2026.4 | 1999. 4 | 434 | 246 | 0.0 | 466 | 0.0 |
| 2Celestine Shiba Mitsui Bldg. Minato-ku, Tokyo Central 5 Wards |
2013. 5 2018. 3 |
2002. 4 | 38,011 | 42,000 | 2.7 | 47,200 | 2.6 |
| 2NBF Shinagawa Tower Minato-ku, Tokyo Central 5 Wards |
2011. 9 | 2003. 4 | 22,778 | 36,300 | 2.3 | 47,700 | 2.6 |
| 2Nihonbashi Honcho M-SQUARE Chuo-ku, Tokyo Central 5 Wards |
2026.3 | 2025.10 | 10,614 | 32,108 | 2.1 | 32,800 | 1.8 |
| 2NBF Platinum Tower Minato-ku, Tokyo Central 5 Wards |
2006. 3 | 2005. 11 | 33,503 | 31,000 | 2.0 | 60,800 | 3.3 |
| 2NBF COMODIO Shiodome Minato-ku, Tokyo Central 5 Wards |
2012. 7 | 2006. 7 | 20,538 | 28,800 | 1.8 | 35,800 | 2.0 |
| 2G-BASE TAMACHI Minato-ku, Tokyo Central 5 Wards |
2019. 3 2019. 4 |
2018. 1 | 12,481 | 28,200 | 1.8 | 29,100 | 1.6 |
| 2Toranomon Kotohira Tower Minato-ku, Tokyo Central 5 Wards |
2004. 11 2006. 4 |
2004. 11 | 16,848 | 24,543 | 1.6 | 34,300 | 1.9 |
| 2NBF Shibuya Garden Front Shibuya-ku, Tokyo Central 5 Wards |
2004. 2 2013. 3 |
2003. 9 | 14,887 | 20,269 | 1.3 | 37,200 | 2.0 |
| 2NBF Ginza Street Bldg. Chuo-ku, Tokyo Central 5 Wards |
2007. 4 | 1990. 6 1997. 9 |
3,440 | 17,000 | 1.1 | 19,000 | 1.0 |
| 2Shinjuku Mitsui Bldg. No.2 Shinjuku-ku, Tokyo Central 5 Wards |
2001. 5 | 1983. 10 | 14,617 | 16,285 | 1.0 | 19,600 | 1.1 |
| 2Kowa Nishi-Shinbashi Bldg. B Minato-ku, Tokyo Central 5 Wards |
2001. 5 2016. 3 2017. 4 2019. 8 2024. 10 |
1994. 8 | 10,405 | 13,536 | 0.9 | 13,400 | 0.7 |
| 2River City M-SQUARE Chuo-ku, Tokyo Central 5 Wards |
2011. 2 | 2010. 1 | 16,261 | 13,350 | 0.9 | 13,500 | 0.7 |
| 2Shinbashi M-SQUARE Minato-ku, Tokyo Central 5 Wards |
2013. 2 | 2011. 10 | 5,390 | 11,900 | 0.8 | 15,100 | 0.8 |
| 2NBF Toranomon Bldg.(Land with leasehold interest) Minato-ku, Tokyo Central 5 Wards |
2004.6 | ー | ー | 11,416 | 0.7 | 18,600 | 1.0 |
| 2GranTokyo South Tower Chiyoda-ku, Tokyo Central 5 Wards |
2021. 1 | 2007. 10 | 2,175 | 9,398 | 0.6 | 9,610 | 0.5 |
| 2NBF ALLIANCE Minato-ku, Tokyo Central 5 Wards |
2004. 7 | 1989. 1 | 4,035 | 9,126 | 0.6 | 13,700 | 0.8 |
| 2Yotsuya Medical Bldg. Shinjuku-ku, Tokyo Central 5 Wards |
2005. 8 | 2004. 5 | 7,481 | 8,800 | 0.6 | 7,460 | 0.4 |
| 2NBF Shibuya East Shibuya-ku, Tokyo Central 5 Wards |
2008. 1 | 1992. 1 | 4,999 | 8,000 | 0.5 | 11,000 | 0.6 |
| 2NBF Takanawa Bldg. Minato-ku, Tokyo Central 5 Wards |
2001. 5 | 1987. 11 | 10,448 | 6,667 | 0.4 | 7,850 | 0.4 |
| 2NBF Akasaka Sanno Square Minato-ku, Tokyo Central 5 Wards |
2005. 2 | 1989. 9 | 5,258 | 6,250 | 0.4 | 8,140 | 0.4 |
| 2NBF Kandasudacho Bldg. Chiyoda-ku, Tokyo Central 5 Wards |
2015. 6 | 2013. 7 | 4,470 | 5,960 | 0.4 | 8,680 | 0.5 |
| 2NBF Ogawamachi Bldg. Chiyoda-ku, Tokyo Central 5 Wards |
2005. 9 2020. 11 |
1986. 10 | 5,340 | 5,420 | 0.3 | 6,600 | 0.4 |
| 2NBF Higashi-Ginza Square Chuo-ku, Tokyo Central 5 Wards |
2005. 3 | 2005. 2 | 4,871 | 5,200 | 0.3 | 7,990 | 0.4 |
| 2Nihonbashi Kabuto-cho M-SQUARE Chuo-ku, Tokyo Central 5 Wards |
2011. 2 | 2009. 6 | 3,298 | 4,850 | 0.3 | 5,570 | 0.3 |
| 2NBF Hatchobori Terrace Chuo-ku, Tokyo Central 5 Wards |
2002. 12 | 1989. 11 | 5,270 | 4,528 | 0.3 | 5,540 | 0.3 |
| 2Ryukakusan Bldg. Chiyoda-ku, Tokyo Central 5 Wards |
2012. 2 | 1991. 11 | 5,332 | 4,050 | 0.3 | 5,270 | 0.3 |
| 2Jingumae M-SQUARE Shibuya-ku, Tokyo Central 5 Wards |
2014. 3 | 2009. 2 | 7,213 | 3,700 | 0.2 | 4,320 | 0.2 |
| 1Toyosu Bayside Cross Tower Koto-ku, Tokyo Central 5 Wards |
2022. 11 2023. 3 2024.3 |
2020. 3 | 51,512 | 80,100 | 5.1 | 80,900 | 4.4 |
| 1Toyosu Bayside Cross Tower(Additional Acquisition) Koto-ku, Tokyo Central 5 Wards |
2026.3 | 2020. 3 | 10,013 | 14,810 | 0.9 | 16,000 | 0.9 |
| 1NBF Osaki Bldg. Shinagawa-ku, Tokyo Central 5 Wards |
2013. 2 | 2011. 2 | 74,425 | 66,660 | 4.3 | 87,400 | 4.8 |
| 1Gate City Ohsaki Shinagawa-ku, Tokyo Central 5 Wards |
2006. 4 2011. 3 2013. 3 |
1999. 1 | 41,880 | 57,281 | 3.7 | 72,000 | 4.0 |
| 1NBF Toyosu Canal Front Koto-ku, Tokyo Central 5 Wards |
2005. 9 | 2004. 9 | 36,639 | 35,200 | 2.3 | 38,500 | 2.1 |
| 1Ueno East Tower Taito-ku, Tokyo Central 5 Wards |
2016. 6 2021. 3 |
2015. 12 | 28,711 | 35,000 | 2.2 | 42,300 | 2.3 |
| 1NBF Toyosu Garden Front Koto-ku, Tokyo Central 5 Wards |
2008. 3 | 2007. 9 | 28,299 | 25,018 | 1.6 | 30,100 | 1.7 |
| 1Osaki Bright Core - Bright Plaza Shinagawa-ku, Tokyo Central 5 Wards |
2016. 11 2018. 3 2019. 4 2019. 10 2020. 3 |
2015. 4 | 14,179 | 24,380 | 1.6 | 25,600 | 1.4 |
| 1Nakameguro GT Tower Meguro-ku, Tokyo Central 5 Wards |
2003. 2 2003. 9 2005. 9 |
2002. 3 | 21,438 | 23,856 | 1.5 | 21,000 | 1.2 |
| 1Osaki Bright Tower Shinagawa-ku, Tokyo Central 5 Wards |
2020. 10 | 2015. 4 | 6,079 | 13,970 | 0.9 | 14,700 | 0.8 |
| 1NBF Ikebukuro East Toshima-ku, Tokyo Central 5 Wards |
2013. 3 | 1993. 2 | 11,073 | 8,630 | 0.6 | 14,300 | 0.8 |
| 1Higashi Gotanda Square Shinagawa-ku, Tokyo Central 5 Wards |
2012. 2 | 2009. 4 | 6,166 | 8,350 | 0.5 | 9,050 | 0.5 |
| 1NBF Ikebukuro Tower Toshima-ku, Tokyo Central 5 Wards |
2004. 6 | 1993. 4 | 5,642 | 4,695 | 0.3 | 6,000 | 0.3 |
| 1NBF Ikebukuro City Bldg. Toshima-ku, Tokyo Central 5 Wards |
2004. 5 | 1993. 2 | 5,021 | 4,428 | 0.3 | 5,820 | 0.3 |
| 3Chofu South Gate Bldg. Chofu City, Tokyo Central 5 Wards |
2011. 4 | 2007. 10 | 13,762 | 9,320 | 0.6 | 9,240 | 0.5 |
| 3Yokohama Mitsui Bldg. Yokohama City, Kanagawa Central 5 Wards |
2025. 3 | 2012. 2 | 38,372 | 43,190 | 2.8 | 44,200 | 2.4 |
| 3NBF Musashikosugi Bldg., N Bldg. and S Bldg. Kawasaki City, Central 5 Wards |
2025. 7 | N棟:2010. 2 S棟:2010. 2 |
22,410 | 29,000 | 1.9 | 30,500 | 1.7 |
| 3Yokohama ST Bldg. Yokohama City, Kanagawa Central 5 Wards |
2001. 5 2021. 11 |
1987. 10 | 24,104 | 16,749 | 1.1 | 23,700 | 1.3 |
| 3Parale Mitsui Bldg. Kawasaki City, Kanagawa Central 5 Wards |
2006. 4 | 1990. 10 | 12,545 | 3,800 | 0.2 | 4,990 | 0.3 |
| 3S-ino Omiya North Wing Saitama City, Saitama Central 5 Wards |
2004. 10 2004. 11 |
2004. 2 | 20,698 | 16,816 | 1.1 | 24,300 | 1.3 |
| 3NBF Urawa Bldg. Saitama City, Saitama Central 5 Wards |
2005. 9 | 1990. 6 | 3,455 | 2,000 | 0.1 | 2,230 | 0.1 |
| 3NBF Matsudo Bldg. Matsudo City, Chiba Central 5 Wards |
2001. 5 | 1992. 8 | 4,770 | 2,455 | 0.2 | 2,550 | 0.1 |
| 4NBF CONNECT SAPPORO Sapporo City, Hokkaido Central 5 Wards |
2025. 11 | 2024.8 | 9,422 | 13,800 | 0.9 | 14,600 | 0.8 |
| 4Sapporo L-Plaza Sapporo City, Hokkaido Central 5 Wards |
2003. 11 2004. 3 2004. 11 2005. 10 |
2003. 3 | 11,396 | 4,404 | 0.3 | 9,240 | 0.5 |
| 4D-TOWER TOYAMA Toyama City, Toyama Central 5 Wards |
2025. 6 | 2024. 2 | 10,949 | 9,000 | 0.6 | 9,240 | 0.5 |
| 4Sumitomo Mitsui Banking Nagoya Bldg. Nagoya City, Aichi Central 5 Wards |
2013. 2 | 2001. 4 | 17,658 | 14,900 | 1.0 | 16,900 | 0.9 |
| 4Nagoya Mitsui New Bldg. Nagoya City, Aichi Central 5 Wards |
2020. 10 | 2011. 5 | 11,222 | 13,200 | 0.8 | 15,300 | 0.8 |
| 4Nagoya Mitsui Main Bldg. Nagoya City, Aichi Central 5 Wards |
2020. 10 | 1987. 3 | 12,989 | 13,050 | 0.8 | 14,300 | 0.8 |
| 4NBF Nagoya Hirokoji Bldg. Nagoya City, Aichi Central 5 Wards |
2004. 3 2008. 3 |
2000.10 2008. 3 |
9,883 | 7,232 | 0.5 | 6,790 | 0.4 |
| 4Nakanoshima Mitsui Bldg. Osaka City, Osaka Central 5 Wards |
2022. 3 | 2002. 7 | 42,389 | 44,000 | 2.8 | 46,500 | 2.6 |
| 4Aqua Dojima NBF Tower Osaka City, Osaka Central 5 Wards |
2004. 9 | 1993. 4 1995.11 1996.12 |
21,917 | 17,810 | 1.1 | 22,400 | 1.2 |
| 4Nakanoshima Central Tower Osaka City, Osaka Central 5 Wards |
2014. 3 | 2005. 8 | 17,279 | 14,900 | 1.0 | 20,200 | 1.1 |
| 4Shinanobashi Mitsui Bldg. Osaka City, Osaka Central 5 Wards |
2006. 4 | 1982. 9 | 24,413 | 14,400 | 0.9 | 14,000 | 0.8 |
| 4Sakaisuji-Honmachi Center Bldg. Osaka City, Osaka Central 5 Wards |
2005. 3 2014. 1 |
1991. 5 | 23,163 | 12,700 | 0.8 | 16,200 | 0.9 |
| 4Yodoyabashi Flex Tower Osaka City, Osaka Central 5 Wards |
2023.11 | 2006.11 | 7,432 | 9,833 | 0.6 | 10,600 | 0.6 |
| 4Hiroshima Fukuromachi Bldg. Hiroshima City, Hiroshima Central 5 Wards |
2003. 11 2012. 4 |
2002. 1 | 3,930 | 2,215 | 0.1 | 2,390 | 0.1 |
| 4NBF Matsuyama Nichigin-mae Bldg. Matsuyama City, Ehime Central 5 Wards |
2012. 3 | 2009. 3 | 5,984 | 3,310 | 0.2 | 4,040 | 0.2 |
| 4Hakata Gion M-SQUARE Fukuoka City, Fukuoka Central 5 Wards |
2011. 2 | 2009. 6 | 14,328 | 8,000 | 0.5 | 13,800 | 0.8 |
| 4NBF Kumamoto Bldg. Kumamoto City, Kumamoto Central 5 Wards |
2008. 3 | 2008. 2 | 7,931 | 4,500 | 0.3 | 4,880 | 0.3 |
| Total | 1,249,156 862,294 521,217 140,115 257,635 | 1,558,967 1,228,381 826,003 123,330 207,254 | 1,820,356 1,191,275 802,226 141,710 228,520 | ||||
- "Total Rentable Area" represents the area of each property as of the end of 2H/'25 (as of December 31, 2025).
- "Acquisition Price" represents, in principle, the price for which NBF acquired the property.
- "Appraisal Value" represents the appraisal value as of the end of 2H/'25 (as of December 31, 2025).
- The building portion of "NBF Toranomon Bldg." was disposed as of January 6, 2025.
"Total Rentable Area" of "NBF Toranomon Bldg. (Land with leasehold interest)" (Leased area of land: 1,804.45 m2) is shown as "-".
The "Acquisition Price" is the land acquisition price at the time of acquisition of the property. - "Nihonbashi Honcho M-SQUARE" and "Toyosu Bayside Cross Tower (Additional Acquisition)" were acquired as of March 31, 2026. The "Total Rentable Area" and the "Appraisal Value" is as of November 30, 2025.
- "Nishi-Shinjuku Mitsui Bldg.(Additional Acquisition)" was acquired as of April 28, 2026. The "Total Rentable Area" and the "Appraisal Value" is as of April 1, 2026.
- "Sumitomo Densetsu Bldg." was disposed as of June 30, 2026.
- "NBF Sapporo Minami Nijo Bldg." was disposed as of July 1, 2026.